Expert Advice with Brett Warren 01/06/2017
Probably the most difficult part of property investing is understanding what the future holds.
If only we could predict the future and how suburbs are going to perform in advance, we would make a fortune!
As part of my research and analysis on a property within a certain suburb, I look to at past performance and history as a guide for what may occur moving forward.
But not just the last 3 – 5 years, I want to understand what has occurred over a number of decades.
Property cycles in general, last roughly between 7 – 10 years.
This would mean I am analysing what has occurred over 2 – 3 full cycles, not just a snapshot in time.
This kind of information is readily available to consumers on sites like RP Data or PriceFinder.
I find that Pricefinder makes it very simple to present this data and make it easier to follow than most.
There are several things I am looking for;
Capital Growth
I am generally looking for suburbs that have continually outperformed the average.
In most cases this will be a known, proven and trusted suburb with a strong track record of Capital Growth.
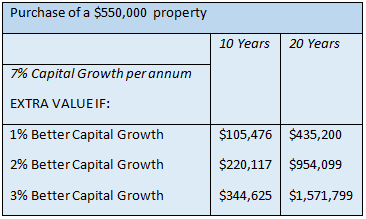
An additional 2 -3 % can make a considerable difference over a decade or two when you factor in compounding capital growth and this is paramount;
What happens in a Downturn?
There is always an economic or financial shock every 7 – 10 years and usually some sort of X Factor in between.
In 2008/09 everyone had to deal with the Global Financial Crisis, however in Brisbane here, we had X Factors such as the floods and mining downturn.
I want to understand how this suburb performed in something like a GFC or mining downturn.
Do prices fall considerably and take 4 – 5 years to return to normal? or do prices come back only 5% to 10% and come back strong within a year or two.
As an investor trying to widen your asset base, 4-5 years waiting on the sidelines just to get back to square one is far from ideal.
Volatility
When analysing the data, I will also keep an eye out for large price fluctuations.
Big cycles of booms and busts over the last few decades are a sign of high volatility and makes things considerably harder when evaluating what may happen in the future.
I am looking for more consistent fluctuations and importantly more periods of expansion versus contraction.
Case Studies
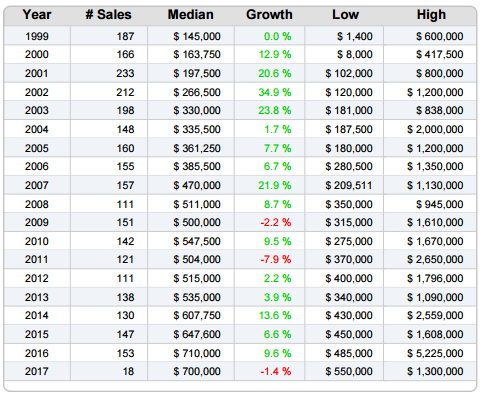
Take a look at the Suburb Profile below.
It’s a suburb in Brisbane that is very well known to us as we have purchased many properties in this location for our clients.
It has a proven track record of above average capital growth, with there being a considerable more amount of green numbers here than there is red.
To understand how this suburb reacts to a downturn, I can look back at 2008 for the GFC and 2011 for the floods.
These are the only times of negative growth, but prices have rebounded strongly within 1 – 2 years.
Interestingly the mining downturn, from around 2013 onwards, has not had such an effect to this suburb as it is not one dimensional.
You can also tell that there is much less volatility over the last few decades and this makes it easier to understand what the future may hold.
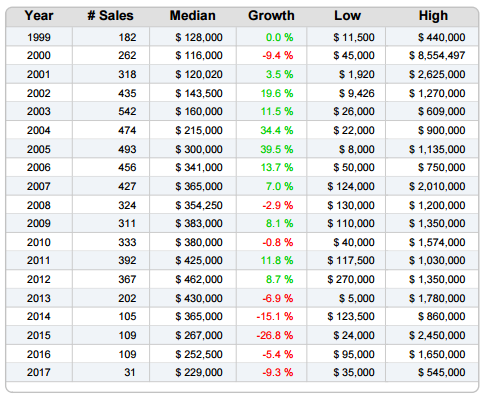
Contrast the above suburb with the one below.
While there were initially strong periods of capital growth (green), you can see there are many more areas of negative growth (red) in the profile.
While there were similar effects in 2008 from the GFC, understandably the Brisbane floods had little effect on this location.
The bigger concern was during the mining downturn from 2013 onwards, where the suburb lost upwards of -63%.
The suburb is too one dimensional and it does not have any other drivers of economic development.
As a result, this suburb also has a great deal more volatility and investors will be left on the sidelines for a considerable amount of time trying to make back gains.
The cycles are extremely volatile and predicting what happens next is virtually impossible.
Summary
Analysing how a suburb has performed can be a vital part of choosing an investment property.
By understanding how a suburb has performed over a number of decades and property cycles, it can leave clues and highlight how it may perform in the future.
You should be looking to find suburbs with above average capital growth that are not significantly affected by major downturns or other localised events.
Low levels of volatility can also make those suburbs more predictable when evaluating what may happen over the next cycle.
Like everything though, there is no guarantee when it comes to knowing what will happen in the future.
But if you apply some of these principles, you will find a suburb that has lower risk than other areas and this may be an ideal place to investigate further.
.....................................................
 Brett Warren is the Senior Property Strategist at Metropole Properties in Brisbane and uses his 12 plus years property investment experience and economics education to advice clients how to build their portfolios.
He is a regular commentator for Michael Yardney's Property Update.
Disclaimer: while due care is taken, the viewpoints expressed by contributors do not necessarily reflect the opinions of Your Investment Property.