Expert Advice with Jeremy Sheppard. 03/06/2016
.jpg) The Housing Industry Association (HIA) publishes a report listing the top residential property markets around Australia which they call “Hot Spots”. But they are not hot spots for investors. On the contrary, investors should probably avoid these locations.
The Housing Industry Association (HIA) publishes a report listing the top residential property markets around Australia which they call “Hot Spots”. But they are not hot spots for investors. On the contrary, investors should probably avoid these locations.
What is a hot spot?
My definition of a hot spot for property investing is based on supply and demand. I want high demand and low supply:
High demand relative to supply = capital growth oh-la-la
A hot spot is one in which demand exceeds supply by such a significant degree that there is tremendous pressure on prices to rise in the short term.
According to HIA hotspots are:
“…areas which enjoy a combination of rapid population growth as well as high levels of residential building”
I love the use of “enjoy” in that sentence.
To the young investor these 2 definitions might seem like the same thing. But they are closer to being the complete opposite.
Table 1 shows HIA’s “National top 20 building and population hotspots”
Table 1 HIA’s hot spots

Source: Housing Industry Association - Population and Residential Building Hotspots 2016
Some investors might read that report and assume these are good investment locations. But these are not hot spots for future capital growth. Some of these markets are actually terrible investment locations.
Investors should be careful to read these reports upside down. You need to know who HIA is and why they claim these locations are hot-spots.
About HIA
HIA are not evil, not to everyone anyway. They do serve a useful purpose.
They have an excellent page on their website declaring their purpose, vision, history, structure, initiatives and more. At least they’re relatively transparent.
However, HIA represent builders. That’s builders of property. Building creates extra supply which helps to keep prices down.
For us evil property investors, we want low supply. We want to target locations in which everything is pointing towards high capital growth.
So HIA actually support our enemies – developers. Their idea of a hot spot should be an investor’s idea of a not-spot.
What’s wrong with residential building?
Oversupply is the worst thing that can happen to a location in terms of capital growth potential. And there’s very little you can do about it after you’ve bought. Your only option might be to sell.
Investors need to make sure they don’t buy into oversupplied areas. Recognising the characteristics of an oversupplied area is not that hard. The percentage of stock on market (SOM%) for example is a great indicator and freely available at DSRdata.com.au.
But investors also need to monitor areas they’ve already bought in, to make sure oversupply isn’t on its way. If so, they can at least sell before things get ugly. Monitoring regional markets is especially important.
Keep in mind that every new property built represents a pin-prick in the capital growth potential for that area.
What’s wrong with population growth?
I wrote an article on this topic for YIP magazine called, “The great population growth myth”. It was published in April 2015.
It was 5,000 words. I know, right? So to summarise…
Population growth often indicates higher supply NOT higher demand of property. Those locations in which population growth is impossible are the ones in which supply is the most constrained. These have much better capital growth potential.
The greatest population growth that indicates the possibility of oversupply is the kind that occurs with heavy developer activity.
New housing estates are a classic example. They are also usually the furthest distance from the CBD where land supply is plentiful and infrastructure and amenities threadbare.
But even CBD locations can be tarnished with high developer activity - in the unit market. Just remember that population growth at a micro level, like suburbs, is not an indicator of increasing demand, but increasing supply. Imagine getting those round the wrong way.
Two side of the equation
Note that supply is not the only side of the equation – demand is important too. Developers have a tendency to focus on demand more so than supply. Although they may get the supply side wrong, they can often find areas with decent demand.
So some of the markets mentioned in HIA’s report will not have the lowest demand to supply ratios (DSR). In fact, the average DSR was 56 which was the median DSR for Australia at the end of April 2016.
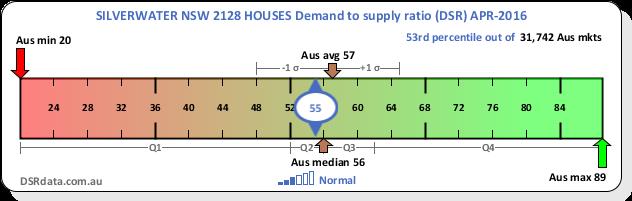
The highest DSR in HIA’s report was 72 - for Melbourne CBD houses. However, the development they mentioned in Melbourne may have been attributed to the unit market, not housing market. The report didn’t specify. The DSR for units in that case was only 66.
Some of the markets in the HIA report had a DSR less than 40. This is in the bottom quartile or “red” area of the graphic above.
There were over 1,000 property markets around Australia with a DSR of 73 or higher. In other words, there are literally tens of thousands of better investment locations than the ones appearing in HIA’s report.
DSR vs HIA
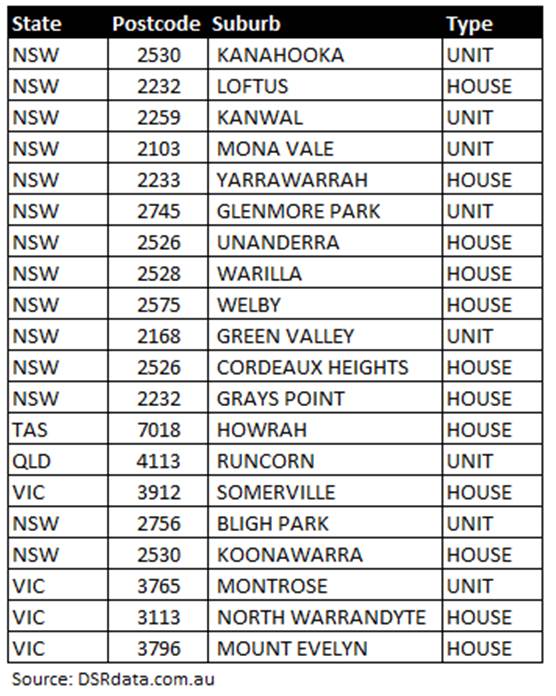
Table 2 shows the top 20 investment markets in Australia by DSR (Demand to Supply Ratio) as at the end of April 2016.
Table 2 – High DSR locations
Note that new properties are more expensive than old ones. Developers never build old properties. So where there is heavy developer activity, the median climbs.
But this is not capital growth. It’s median growth – not the same thing. If you’re ever to find a market with negative capital growth but rising medians, it’s one with heavy developer activity.
So don’t come pointing your finger at me 12 months from now saying I was wrong. Capital growth is not accurately measured in markets with heavy building.
Who loves HIA?
Obviously HIA is a good thing for developers and their builders. And the more development, the more supply which keeps a lid on prices. So, first home buyers might respect them.
The report might also come in handy for real estate agents selling developer stock. In fact, the marketing arm of many a developer jump on these sorts of reports.
I’ve even noticed one award winning buyers agent in QLD referring to this report as a plus to invest in some of these locations. Hmm.
Not all BAs are created equal. Before enlisting their help, check if they understand the concept of supply and demand. Most BAs I know totally get it. In fact, a lot of them are members of DSR Data.
Conclusion
Sure it all comes down to supply and demand. But how you interpret the statistics to come up with a demand to supply ratio (DSR) is crucial. Far from being top spots, heavy developer activity actually creates “bot-spots”.
....................................................................................
 Jeremy Sheppard is head of research at DSRdata.com.au and LocationScore, both are specialist property investment research company that provides research software platforms in the Australian property market. He’s naturally an active property investor and a self-confessed property-data nutcase!
Jeremy bought his first investment property in 2002. By 2009, he had amassed a portfolio of 16 properties in both Australia and New Zealand. Some of his purchases doubled in value in less than 3 years without any renovation, subdivision or development.
DSR data can be found on the YIP Top suburbs page.
Click Here to read more Expert Advice articles by Jeremy Sheppard
Disclaimer: while due care is taken, the viewpoints expressed by contributors do not necessarily reflect the opinions of Your Investment Property.